
Pandas Cookbook
Pandas is a Python package with extensive data management and analysis functionality. In this section, we will review a handful of practical techniques for taking advantage of Pandas capabilities. This is not intended to be an exhaustive review of Pandas; rather, we focus instead on using Pandas to perform common data management and analysis tasks. There are excellent resources on pandas online, starting with the official site, https://pandas.pydata.org. An excellent 10-minute tutorial for pandas beginners is also available online.
Central to Pandas is the DataFrame object, which holds rectangular collections of data (rows and columns - think of an Excel spreadsheet). It is a table of data, and Pandas provides a number of methods and objects for manipulating and analyzing this data.
In this cookbook, we focus on providing recipes for the following common pandas tasks:
- Reading and writing data from a CSV or Excel file.
- Creating a Pandas dataframe from data
- Extracting rows, columns of data from a Dataframe
- Filtering Datasets with a Query
- Sorting Data in a Dataframe
Reading/writing data from/to a file
Pandas provides a set of high-level functions for reading and writing data files in several common formats, perhaps most helpfully, CSV (comma-separated values) and Microsoft Excel files. In all of the cases below, data is read into a DataFrame object, rows and columns of data, including labels. The DataFrame object exposes a number of methods we will take advange of below, but let's start with getting a DataFrame filled with data from a file.
The read_csv and read_excel functions used below have many additional options - see the documents at:
import pandas as pd

# read a local CSV file
#df = pd.read_csv( '/somepath/somefile.csv' )

# read from a web url
#df = pd.read_csv( "http://somewhere.com/somedataset.csv")

# some options - change field delimiter
#              - skip top two rows before reading header, data
#              - only get columns 0, 3 and 4
#df = pd.read_csv( '/somepath/somefile.txt', sep=' ', skiprows=2, usecols=(0,3,4))

# some more options - interpret'Date" field as 'date' type
#              - tell it that our dates have the date first instead of the month first
#              - set the index to be the 'Date' column
#df = pd.read_csv( '/somepath/somefile.txt', parse_dates=['Date'], dayfirst=True, index_col='Date' )

# using excel instead csv/text file
#df = pd.read_excel( '/somepath/somefile.xlsx')   # all the option above apply here as well
df = pd.read_excel( "http://explorer.bee.oregonstate.edu/Topic/Modeling/data/PandasExample.xlsx")   # from a web address
print(df)

# ---- Saving data ----

# save as CSV (see docs for options)
#df.to_csv('somefile.csv')

# save as Excel (see docs for options)
#df.to_excel('somefile.xlsx')
import pandas as pd

years = [2010,2011,2012,2013,2014]
fireArea = [1.455,2.433,1.665,4.344,5.1243]

# merge the two lists into pairs of data
dataset = list(zip(years,fireArea))
print('Zipped list: ', dataset)

df = pd.DataFrame(data=dataset, columns=['Years','Fire Area'])
print( '\nDataFrame:')
print(df)
# save as a csv file.  See docs for options
#df.to_csv('somefilename.csv')
Getting Columns of Data from a DataFrame
We can extract a column of data from a dataframe using the column label as a dictionary key (using bracket ([]) notation, returning a column of data (along with an index, of one exists for the DataFrame). The data is return into a pandas Series object, which is basically a wrapper around a numpy array.
import pandas as pd
# get some data
df = pd.read_excel( "http://explorer.bee.oregonstate.edu/Topic/Modeling/data/PandasExample.xlsx", parse_dates=['Date'], index_col='Date') # from a web address
stationIDs = df['StationID']
discharges = df['StreamDischarge_cfs']
# get the underlying numpy array
d_array = discharges.values
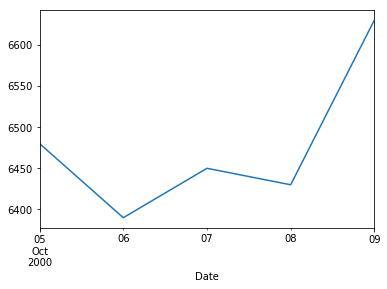
# we can also plot the data! Note that the x axis takes advantage of the index we specified above.
discharges.plot()
import pandas as pd
# get some data
df = pd.read_excel( "http://explorer.bee.oregonstate.edu/Topic/Modeling/data/PandasExample.xlsx",
parse_dates=['Date'], index_col='Date') # from a web address
# print column names
print( "Column names")
print( df.columns)
# print the first few rows (using slicing)
print('\nFirst few rows')
print( df[:3].to_string() )
# print first few rows of a given column
print('\nFirst few rows of "StationID"')
print( df['StationID'][:3].to_string() )
# get multiple columns. NOTE the columns names are in a list inside the indexer []s
print('\nMultiple columns')
print( df[['StationID','StreamDischarge_cfs']][:3].to_string() )
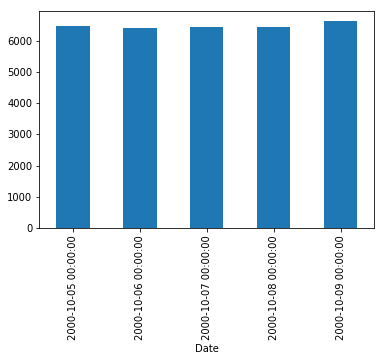
# and a bar chart!
df['StreamDischarge_cfs'].plot(kind='bar')
import pandas as pd

# get some data
df = pd.read_excel( "http://explorer.bee.oregonstate.edu/Topic/Modeling/data/PandasExample.xlsx",
                   parse_dates=['Date'], index_col='Date')   # from a web address

# print the full dataframe
print("\n\n-- Full DataFrame  ------------------------------------\n")
print(df.to_string())

# filter to only queries that have MeanAirTemps greater than 10C
print("\n\n-- Filtered (MeanAirTemp>10) --------------------------\n")
print(df.query('MeanAirTemp_C > 10').to_string())

# the next example show "chained" query statements
print("\n\n-- Filtered (MeanAirTemp>10 and MaxStreamTemp>14.5) ---\n")
df1 = df.query('MeanAirTemp_C > 10').query('MaxStreamTemp_C > 14.5')
print( df1.to_string())

# the next example shows usage of pandas boolean operators in the query string
print("\n\n-- Filtered (MeanAirTemp>10 and MaxStreamTemp<14.5) ---\n")
df2 = df.query('MeanAirTemp_C > 10 & MaxStreamTemp_C < 14.5')
print(df2.to_string())
import pandas as pd

# get some data
df = pd.read_excel( "http://explorer.bee.oregonstate.edu/Topic/Modeling/data/PandasExample.xlsx",
                   parse_dates=['Date'], index_col='Date')   # from a web address

# print the full dataframe
print("\n\n-- Full DataFrame  ------------------------------------\n")
print(df.to_string())

# sort based on stream discharge
dfSorted = df.sort_values(by=['StreamDischarge_cfs'],ascending=True)
print("\n\n-- Sorted by Stream Discharge --------------------------\n")
print(dfSorted.to_string())