
Anatomy of a Python Program

Python programs (and just about any program, for that matter) can be thought of as recipes that contain a a stepwise series of instructions to acomplish some task. In Python programming, these steps are accomplished by writing down the instructions, in order, using a specific syntax that us understood by the Python interpreter. The process of running a program involves storing these instructions in a text file (with a .py extension) and then asking a Python interpreter to process this file. Much of the process of learning to program involves understanding the specific syntax for the programming language being used.
In general, programs deal with data. This data comes in various forms - things like strings, integer, real (floating point) numbers, but also more complicated objects like arrays and lists (storing multiple objects), dataframes (storing rectangular datasets), images, and many others. Programming languages provide methods for operating on this data, like adding numbers, computing various mathematical functions, reading and writing data, visualizing data and many others. Python provides a rich set of these capabilities, some of which we will explore below.
We will start with a traditional first program, printing the string "Hello World" to the console. In Python, this is a simple task, requiring one line of code as shown below. This very simple program demonstrate a couple of programming concepts: 1) the idea of invoking a function (print), a "prepackaged" functionality, that takes an argument and does something with that argument, in this case printing it to the console, and 2) the idea of a data type, in this case a string consisting of the characters Hello World. Also note that in the code blocks below, we provide working python code in the In[ ] blocks, and output from the code in the Out[ ] blocks.
# this program prints the string "Hello World" to the console
print( "Hello World")
Some things to note about the program above:
Anything to the right of a # (hash) character is consider a comment and is ignored by Python. Comments are useful for documenting what the program is doing.
Hello Worldis a string. Strings are always enclosed with single quotes (') or double quotes ("), e.g.'this is a string'printis the name of a function. Functions are pieces of code that (optionally) take arguments (enclosed in parentheses) and operate on those arguments to produce a result or take an action. In this case, theprintfunction takes a single argument, a string, as prints the argument to the console.
A more interesting example - calculating a fibonacci sequence
The second example calculates the Fibonacci sequence for the the integers 1-10 and prints them to the console. We provide a user-defined function to calculate the Fibonacci values for a given integer, and loop through the integers in order, calculating and printing the sequence values. Recall that the Fibonacci number of a given integer is the sum of all integers less than that number; Specifically:
$ F(0) = 0, F(1) = 1, F(n) = F(n-1) + F(n-2) $ for n > 1
# define a function that takes as input an integer,
# and returns the Fibonacci number for that sequence
def Fibonacci(n):
    if n < 1:
        return 0
    elif n == 1:
        return 1
    else:
        return Fibonacci(n-1)+Fibonacci(n-2)

# main program - print n, Fibonacci(n) for n in [1,9]
for i in range(1,10):
    print(i, Fibonacci(i))
Some things to note about the program above
- We define a function with the
defkeyword, followed by an open parenthesis ((), a list of arguments, a closed parenthesis ()) and a colon (:). Anytime this function is called, it recieves an argument (n) and executes the program code associate with the function. - n is a variable that can be assigned different values as needed.
- Conditional statements (e.g.
if,elif("else-if"), andelsetest conditions and branch a program's sequence of execution based on the test. The==operator test for equality. - Loops are indicated with the
forstatement.forstatments repeat for a set of values, in this case a range of integers going from 1 to 9. Therange()function ruturns an array of numbers starting with the first argument (1), and continuing up to (but not including) the last argument, in this case, 10, in increments of 1. - The
returnstatement indicates that the function is finished. Optionally, we can return results from the function, in this case the compute Fibonacci value for n. - The indentation level of a statement matters! in the conditional statements above, the level of nest determines which code lines are associated with each condition (or other program control block, like
foranddef). - Statements with no indentation (all the way to the left) comprise the main program - this code is where execution starts when a program is run.
A more useful example - reading and charting data
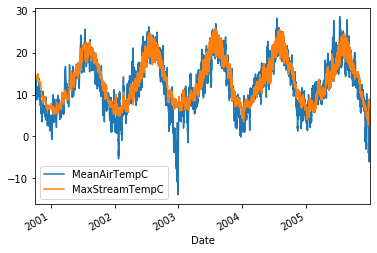
The following program shows of how Python can be used to address more useful problems, in this case reading a dataset from a website (URL) and generating a visualization of the dataset for display. It demonstrates the use of high level functions for performing key tasks, and the idea of importing prepackaged functionality from Python libraries available to your programs. This functional is accessed using the import statement, which loads functionality from the specified package (library) into your program. In the example below, we import a package called pandas, a widely used data management and analysis library we will use frequently. We use pandas to read a CSV (comma-separated values) file forom disk, print a list of column headers, print the first few records (the head) of the dataset, and then plot two of the columns of data, once as time series, followed by a plot of one column against the other.
import pandas as pd # imports the pandas library into our program
# first, we read a dataset using pandas' read_excel() function.
df = pd.read_csv('StreamTemp.csv', parse_dates=['Date'])
# print the column labels and first few records
print(df.columns.values)
print("")
print(df.head())
# plot some of the columns
df.plot('Date',['MeanAirTempC','MaxStreamTempC'])
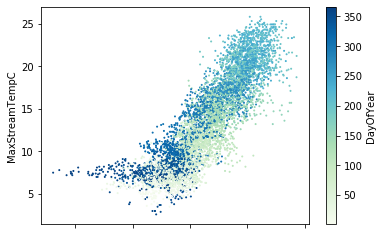
df.plot.scatter('MeanAirTempC','MaxStreamTempC', c='DayOfYear', s=1, colormap='GnBu')
Some things to note about the program above
- The
importstatement load the pandas data analysis package into our program, which we can access through thepdname. pandasexposes many function for working with data - in this case, we take advantage of theread_excel()function that reads Excel spreadsheets. There are many optional arguments to this function for handing special circumstance, but all we need to read our spreadsheet is the a filename referencing a local Excel file, and instruction to interpret the Date column as adatetype defined by Python.pandascan also load dataset from an internet location.- The
read_excel()function returns a Dataframe object, which consists of rows and columns of data mirroring that in the Excel spreadsheet, alond with additional information like indexes, column labels, etc. We store this Dataframe in a variabledf. pandassupportsplotting the data as well, using thematplotlibplotting package underneath the hood. We'll see lots of examples ofmatplotlibin action; it is a very powerful plotting package for 2-D and 3-D plotting.
# This is a typical Python program.  We start with a "comment" - descriptive text that
# is ignored by Python but allows one to document a program.  This text block is an
# example of a comment.  Everything to the right of a '#' character is a comment

import numpy as np   # this is an import statement.  It allows us to utilize prexisting
                     # libraries of code (and associated functionality) in our programs.
                     # In this case, we are importing the "numpy" library, whci provides
                     # support for arrays, mathematical operations on arrays, and a lot more


# Next, we define a function.  In this case, the function will convert Fahrenheit temperature
# values to Celsius.  Functiosn start with the *def* keyword, may accept arguments (inputs),
# and typical return the results of a calculation.  Zero or more variables may be returned
# from a function.
def FtoC(FValues):
    CValues = (FValues - 32) * 5.0/9.0
    return CValues

# Next, we define a "main" program.  In this program, we will:
# 1) create an array of Fahrenheit temperatures between 0 and 120 in increments of 5,
# 2) convert them to Celsius
# 3) print the pairs of values to a table

fvalues = np.arange(0,121,5)   # call a function to create an array of F temperature values between 0, 120
cvalues = FtoC( fvalues )      # convert those values to celsius be calling our function

# at this point, we have two arrays, one with fahrenheit values, one with celsius values.  Let's make a table
# by printing these arrays to the console, using various formas of the "print" function.  We start with a
# header, and then use a "for" loop to iterate through the two arrays, printing temperature pairs

print( "Fahrenheit | Celsius   ")
print( "-----------------------")
for i in range(0, len(fvalues)):
    print("{:6.1f}      {:6.1f}".format( fvalues[i], cvalues[i]))

# all done